Top 15 Chart Pattern For Trading| Chart Pattern For Trading
- Thoufeeq.T
- Dec 24, 2022
- 3 min read
Updated: Feb 12, 2023

chart patterns are really helpful to become a profitable trader. By using the chart patterns you can identify three favorable points they are break out points, trend reversal points, trend continuation points. By understanding chart patterns you can find these points. so lets start…
Bilateral Chart Pattern.
Bilateral chart pattern is more tricky that signal that the price can move either way. Either the price will move with the current trend, or the price will move against the current trend.
Trend Reversal Chart Pattern.
Trend reversal chart patterns are those formation that signal that the ongoing trend is about to reverse.
Trend continuation chart Pattern.
It is those chart formation that signal that ongoing trend will resume or continue.
Now I will share with you all the chart patterns inside these three categories.
Bilateral chart pattern.
Triangle pattern
symmetrical Triangle.
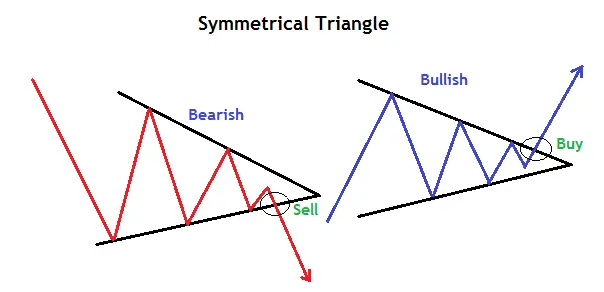
This is a powerful pattern, as you can see in the picture it has lower highs and higher lows. Wait for the break out , you can use 5min time frame for intraday.
2. Ascending Triangle.

In ascending triangle as you can see in the picture the highs are same and higher lows, here also you can wait for the breakout.
3. Descending Triangle.
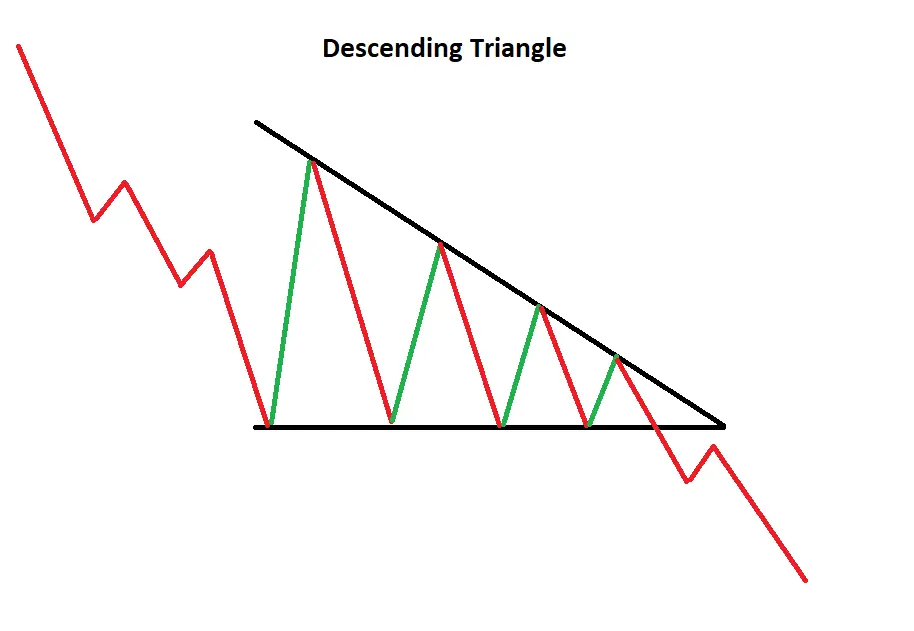
In descending triangle the lows are same and lower highs , you can wait for the breakout.
Trend reversal chart Pattern.
Double Top and Double Bottom
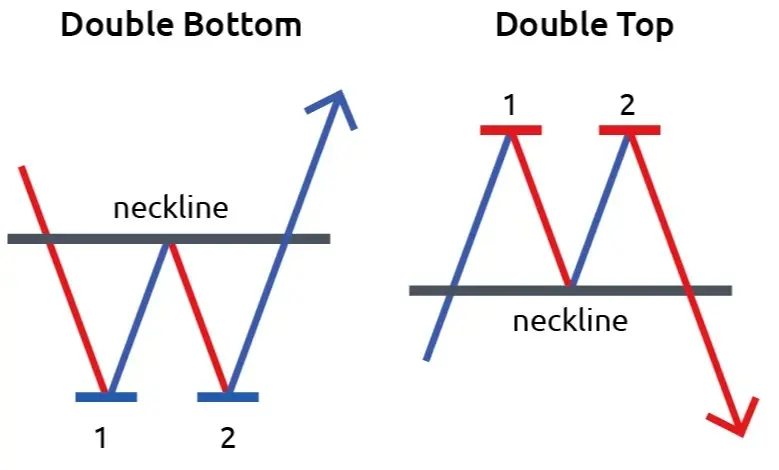
A double top is an extremely bearish technical reversal pattern that forms after a stock or index reaches a high price two consecutive times with a moderate decline between the two highs.
A double bottom pattern is a classic technical analysis charting formation showing a major change in trend from a prior down move. The double bottom pattern looks like the letter "W.”
Head and shoulder pattern.

The head and shoulders formation occurs when a market trend is in the process of reversal either from a bullish or bearish trend. it looks like head and shoulder as you can see in the picture. you can look for breakout from the neckline.
Inverse head shoulder pattern.

It is similar to head and shoulder pattern but it is inverse as you can see in the picture. you consider taking the trade after the breakout from the neckline.
Rising Wedge.

A rising wedge is generally a bearish signal as it indicates a possible reversal during an up-trend. Rising wedge patterns indicate the falling of prices after a breakout.
Falling wedge.
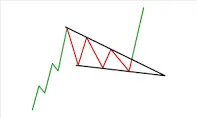
The falling wedge pattern occurs when the asset's price is moving in an overall bullish trend before the price action corrects lower. it is simply opposite of rising wedge.
Rounding bottom.

A rounding bottom is a chart pattern used in technical analysis and is identified by a series of price movements that graphically form the shape of a "U".
Trend continuation pattern.
Bullish Rectangle

Bullish rectangles are continuation patterns that occur when a price pauses temporarily during an uptrend between two parallel levels before the trend continues. All lows and highs are at same line.
Bearish Rectangle
The bearish rectangle is a continuation pattern that occurs when a price pauses during a strong downtrend and temporarily bounces between two parallel levels before the trend continues. it is opposite of bullish rectangle.
Bullish pennant pattern

The bullish pennant is a bullish continuation pattern that signals the extension of the uptrend after the period of consolidation is over.
Bearish pennant pattern
A bearish pennant is a technical trading pattern that indicates the impending continuation of a downward price move. They're essentially the opposite to bullish pennants.
Pole and flag continuation.

A flag and pole pattern describes a specific chart formation used to identify the continuation of a previous trend from a point at which the price moved against the same trend. In this pattern, the price makes a sharp move in one direction, reminding the viewer of a pole on a flagpole.
Cup and handle
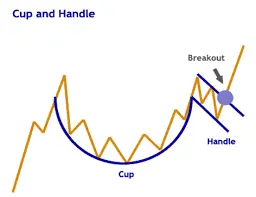
A cup and handle is considered a bullish signal extending an uptrend, and it is used to spot opportunities to go long. This is also a trend continuation pattern.
Conclusion
By understanding these patterns in the chart you can identify entry points and in trading entry and exit is very important. wrong entry point can lead you to loss making trade. to avoid that understand the above chart patterns and try to find the patterns in charts.
understand all the above patterns by looking the image as well. you can use this chart patterns in intraday, positional, swing trading .
If this article is helpful, if you learn something new consider reading our other article that we write to provide stock market education for free. follow as on social media platforms like Instagram, twitter, Youtube. If you have doubts feel free to comment below.


Comments